
Milk and Peanuts: Past Performance Is Not a Reliable Indicator of Future Performance
- Dennis Barton

- Dec 3, 2025
- 4 min read
If one has not read a warning on a wine bottle label concerning traces of milk, one is probably a teetotaller. In a similar vein, who has not seen a peanut warning in an unlikely place? Such warnings serve many purposes including to mollify the product liability insurer, to placate the chief risk officer and to distract the regulator. In rare cases, they may prevent death or injury to a consumer.
The financial services sector also has its “milk and peanuts” notes. The two most prominent are Part IVA to the Income Tax Assessment Act (ITAA) and Australian Securities and Investment Commission (ASIC) Regulatory Guide 53.
Andep’s Statement of Advice template contains the following “The general anti-avoidance rules contained in Part IVA of the Income Tax Assessment Act 1936 (Cth) (Part IVA) may be applied to deny a taxpayer the tax benefit of a scheme they have entered into. This can apply where the sole or dominant purpose of an action is to obtain a tax benefit.”
Part IVA is rarely invoked but could apply to a lot of common transactions and decisions (which are best left undescribed) if the Commissioner were so minded.
ASIC Regulatory Guide 53 (RG 53): “The Use of Past Performance in Promotional Material” contains at Sub clause 8.2.3 “Possible wording for a future performance warning includes “Past performance is not a reliable indicator of future performance.’”. Hence the ubiquitous warning we have all glossed over.
One can ask “is the warning true?” and answer that question on an absolute and a relative basis.
If one is concerned with absolute performance, it is probably untrue but, perversely, not in the way the regulator would have expected. Most markets revert to trend over time and if a market is above trend, it is likely to revert at some time generating poor performance, so one can argue good performance is an indicator of future bad performance.
The chart below shows the main USA stock market index with a thirty year trend and 10% and 90% probability bounds. If one accepts that the trend describes the market’s progress, it is now at levels that can only be expected to occur 3% of the time and that were not to be expected before 2032.

The market has risen at a compound rate of nearly 25% in the last two years nearly 23% in the last three years. This past performance arguably guides an opinion that future performance will be modest for some time. Although hidden in the scale of the chart, such has happened many times before, 1983, 1987 1993, 2003, 2009,2016 and, of course, Covid related 2020.
Turning to relative performance the question becomes “does past performance of one fund manager relative to others or to an index guide future performance?”.
To examine this, one can examine monthly performances relative to benchmark. In this case the subject is major Australian fund manager’s flagship Australia equities fund and the comparator the ASX 200 accumulation index. One can plot progress of a subject and comparator as they accumulate to a common end point as below. Because the subject started from a lower base to get to the same end, it grew faster than the comparator.

This is reflected in the fact that the subject achieved monthly average returns 0.14% greater than the comparator.
In this case, does 0.14% per month reflect intrinsically superior performance or random fluctuations? Here is where statistical analysis comes in.
If one assumes there is no difference between the subject and comparator, based on the variability of the under and over performance and the length of the period examined, one can conclude that there is, in this particular case, a 50% chance that the excess of the monthly average performance of the subject over that of the comparator is between - 0.21% and + 0.21%.
Any excess outside the range is unlikely to have occurred by chance. In this case, the excess is not outside the range. If it were, one could say that on the balance of probabilities, the subject’s underlying performance is different from the comparator. But this is not the case so whether the subject’s underlying performance is better is indeterminant.
One can go further and note that there is a 5% probability of the average difference being outside the range -0.51% to 0.51%. Were this to have occurred, one could have said that it is beyond reasonable doubt that the two underlying performances are different.
The probabilities discussed above, and the observed average are charted below. The chart shows for each probability, on the horizontal axis, the average difference that one would expect to occur or be below on the assumption that the two distributions are the same.

Another view of the situation follows.
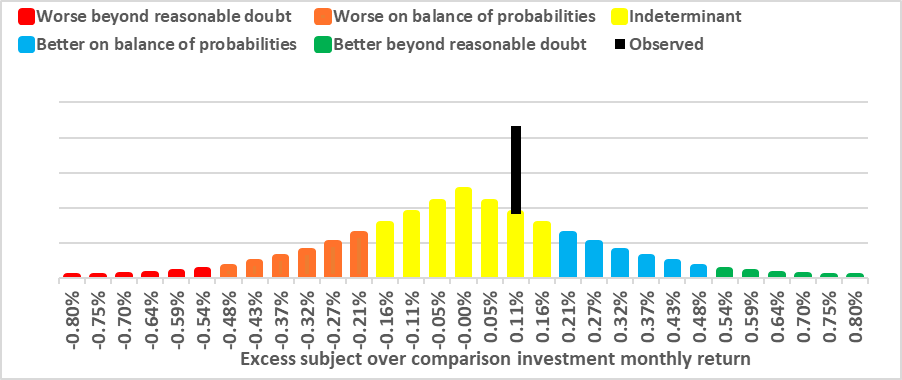
So in this case, while the subject performance is noticeably better than the comparator, one cannot say the difference is a guide to the future. The difference is visible but not significant.
A final caveat – even if the difference were significant, one would have to be satisfied that there have been no changes that might affect future relative performance. For example, departure of key staff to whose skills one might attribute past performance. In the superannuation context, a superannuation fund might move from the common industry practice of employing a panel of external managers to take the detailed investment decision making in house.
In either of these cases all bets are off until the new management can demonstrate out performance.

The discussion surrounding product warnings can draw interesting parallels to the financial sector's disclosures. In both cases, the intent is to mitigate risk and protect stakeholders. However, the effectiveness of such warnings in guiding consumer choices is debatable. When it comes to investment performance, the adage https://www.civilunions.org.nz regarding The Pokies raises an important https://thepokies119.net/ point: past results may mislead future expectations, highlighting the complexity of interpreting trends accurately.
Product warnings often illustrate how risk management and liability concerns shape modern labeling practices. While some notices may seem excessive, they reflect attempts to manage legal exposure, and in broader online discussions even unrelated references like https://financedistrict.co.nz/ Royal Reels sometimes appear when people compare recognizable names across different contexts.